Performance Dashboard
Every morning a hygiene manager asks the same question: did the line get cleaned last night, by whom, on budget – and what's about to go wrong? Answering it used to mean pulling clock-in sheets, cleaning records and the roster together by hand. I built the one screen that answers it.
The problem
The data to run a shift already exists – who clocked in, what got cleaned, how long each job took, who's off – but it lives in different places. To see whether last night went well, someone reconciles it by hand every morning. By the time a pattern shows up, like a machine that's always over its cleaning-time budget or a team quietly slipping on adherence, it's already a problem, maybe already an audit finding.
The solution
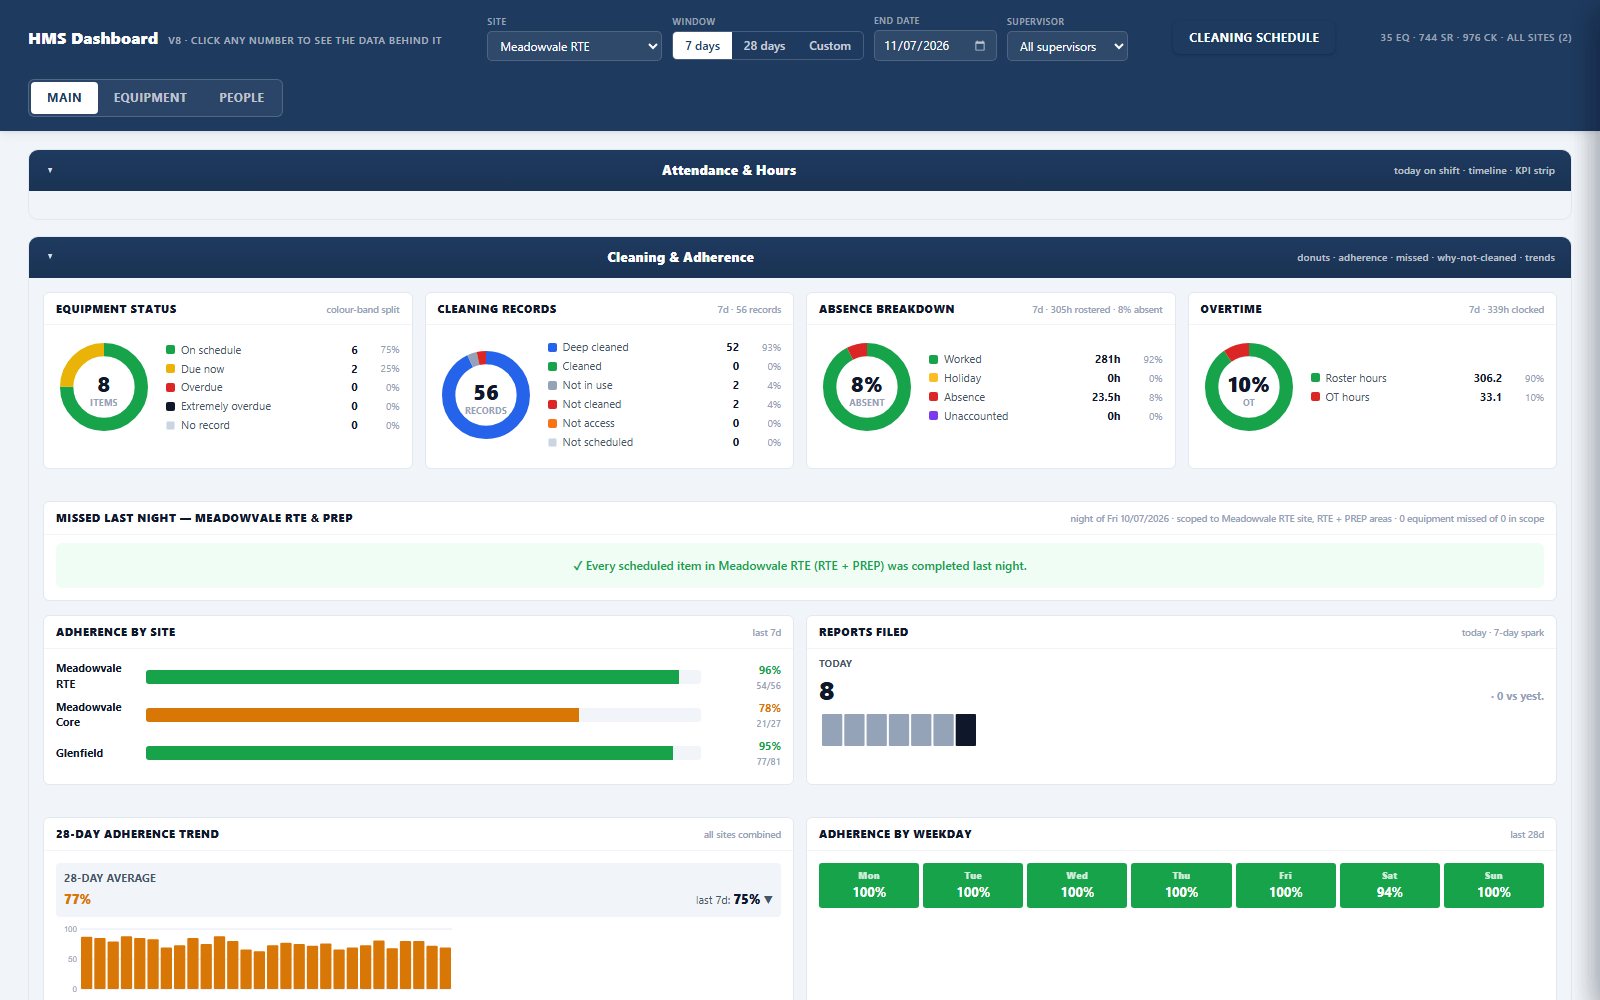
One dashboard sits on top of the whole system and reads it live.
- The night at a glance. Planned against actual clockings, equipment cleaning status, and who was on site – the shift, shown as it really ran.
- Ring gauges for the things that drift. Adherence by site, area and weekday, absence and overtime, and team efficiency – credit-hours against hours worked – each as a dial you read in a second.
- It tells you what to look at. The dashboard flags equipment consistently over or under its cleaning-time budget, so a problem surfaces before it becomes a failure.
What changed
The morning reconciliation became a glance. A manager can see the whole operation – both sites, every team – on one screen, and the recommendations point at what's slipping while there's still time to fix it. It reads the live system, so the numbers are never a day old.
Where it runs
It runs on a live factory’s data, so there’s no public version – I’m glad to walk you through it on the demo dataset.
Internal tool Get in touch →